ETF Flows Weekly #4: The $2.6 Billion Answer
 August 24, 2026
5 min read
August 24, 2026
5 min read
Disclosure: Information and opinion, not financial advice. Flows cover August 17-21, 2026, primarily per SoSoValue, and revise as providers reconcile. Full disclaimer.
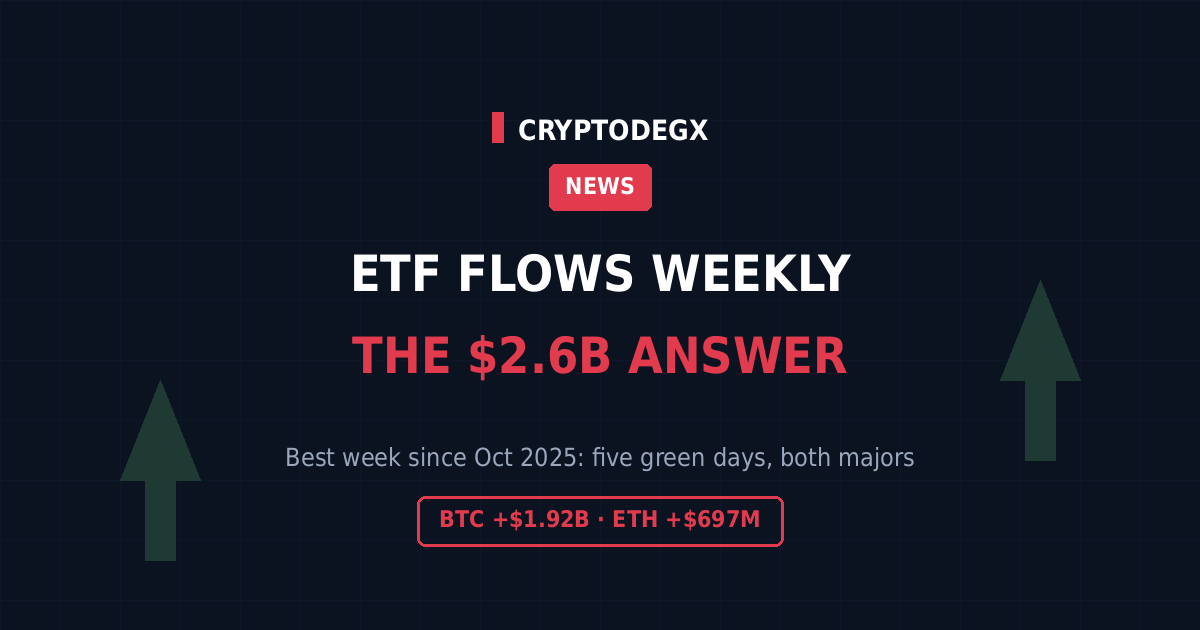
Edition four, and the tape finally picked a direction: $2.62 billion flowed into US spot Bitcoin and Ethereum ETFs last week, the strongest combined week since October 2025, with five green days out of five for both asset classes.
Bitcoin funds took $1.918 billion, their largest week of 2026. Ethereum funds added $697 million, also a 2026 record and their best showing since early October. The swing from the prior week’s $392 million outflow: three billion dollars, in one week, in the same direction as a 22% price move.
The daily tape tells the real story
Monday $297.5M, Tuesday $189.3M, Wednesday $517.2M, Thursday $606.3M, Friday $307.5M. Notice the shape: the flows accelerated into the breakout, with the two biggest days landing exactly on the sharpest leg of the price move, as Bitcoin cleared $65,000, $70,000, and $75,000 in sequence and briefly touched near $80,000 on Friday.
BlackRock dominated both sides: IBIT absorbed $1.33 billion of the Bitcoin total and took 78% of Friday’s flows alone, while ETHA accounted for $536.8 million of Ethereum’s week. Wednesday was ETH’s single best day since October, $221 million.
Grading our own question
Last week’s rally coverage ended with a test we set in public: was the 22% move a short squeeze or real buying? The flow data’s answer is both, in sequence. The squeeze lit the fire, with roughly $3 billion in liquidations (mostly shorts) as Bitcoin crossed $70,000. The flows then confirmed it, five straight days of institutional creations, accelerating as the move extended.
Now the honest asterisk, because this series exists to apply them: flows that cluster on a rally’s best days are momentum-following by definition, and momentum-following money historically fades when the momentum does. The conviction test isn’t a $606 million Thursday during a breakout. It’s what Monday looks like after the first real red day. That’s the number edition five gets graded on.
The satellites, refined in public
Our altcoin ETF thesis said the small funds behave counter-cyclically, feeding when the majors bleed and starving when they feast. The bleeding half got confirmed two weeks ago. This week tested the feasting half, and the result asks for a refinement rather than a victory lap: XRP funds took $39.8 million on a four-day run, Solana $28.3 million, HYPE $3.9 million. Fed, not starved.
But look at the proportions: the satellites’ combined $72 million was under 3% of the week’s total while Bitcoin alone took 73%. So the amended thesis, stated for future grading: in famines the satellites get fed deliberately; in feasts they get crumbs from the table. Tactical either way, never the meal.
Perspective, before anyone extrapolates
Three numbers keep the champagne corked. Both categories remain net negative for 2026 year-to-date, tracking toward their first-ever annual outflow. Bitcoin’s cumulative $53.7 billion still sits well below its October 2025 peak of $62.8 billion. And total ETF assets jumped $23 billion last week while flows were $2.6 billion, meaning price appreciation did roughly nine times the work that new money did. Reading the asset line as demand overstates the week ninefold; the flow line is the one that tracks actual decisions.
One research desk’s ETF-flow model now frames Bitcoin’s supported range at $67,000 to $78,000 with fair value near $72,000, which is a useful anchor for reading this week’s price action around $76,500 as full, rather than cheap, relative to the flows that exist so far.
What to watch this week
The red-day test above everything: do creations continue when price doesn’t cooperate? Whether XRP’s four-day run survives the satellites’ usual gravity. And whether IBIT’s dominance (nearly four of every five Friday dollars) broadens, because a rally carried by one issuer’s flows is a rally with one point of failure. Edition five lands next Monday, same format, same public grading.
FAQ
What were Bitcoin ETF flows for the week of August 17-21, 2026?
A net inflow of $1.918 billion per SoSoValue, the largest weekly total of 2026 and the biggest since October 2025, with inflows on all five sessions: $297.5M, $189.3M, $517.2M, $606.3M, and $307.5M. BlackRock’s IBIT led with $1.33 billion of the total.
What were Ethereum ETF flows that week?
About $697.2 million, Ethereum funds’ best week of 2026 and their strongest since early October 2025, led by BlackRock’s ETHA at $536.8 million. Wednesday’s $221 million was the largest single ETH day since October.
Why did crypto ETF inflows surge in late August 2026?
The inflows accompanied Bitcoin’s 22% rally: a record short squeeze (roughly $3 billion liquidated) ignited the move, and institutional creations accelerated as price broke $65,000, $70,000, and $75,000 resistance. The largest flow days clustered on the sharpest price days, a momentum pattern whose durability gets tested on the next red day.
Did altcoin ETFs get inflows during the rally week?
Modestly: XRP funds took $39.8 million on a four-day run, Solana $28.3 million, and HYPE $3.9 million, together under 3% of the week’s combined total. The satellite funds participated in the risk-on move but at crumb scale next to Bitcoin’s 73% share.
Are Bitcoin ETFs positive for 2026?
Not yet: despite the record week, both Bitcoin and Ethereum ETF categories remain net negative year-to-date and are tracking toward their first annual net outflow since launching. Bitcoin’s cumulative $53.7 billion also remains below its October 2025 peak of $62.8 billion.
Which ETF got the most inflows during the week?
BlackRock’s IBIT dominated with $1.33 billion for the week and 78% of Friday’s Bitcoin flows alone; its ETH counterpart ETHA led that category with $536.8 million. Fidelity’s funds ran a distant second on both sides.
Is the rally supported by real demand or a short squeeze?
Both, in sequence: the squeeze provided the ignition and the flows provided five days of confirmation. The caveat is that creations clustered on the strongest price days, which reads as momentum-following; the durability test is whether inflows persist through the first significant down day.
Where does ETF flow data come from?
Issuers disclose creations and redemptions daily, aggregated by trackers like SoSoValue and Farside Investors, whose figures differ slightly due to windowing and methodology. This edition primarily cites SoSoValue; directions across providers agreed on all five sessions.